EdGCM Teaching Tips
Global warming experiment as an example
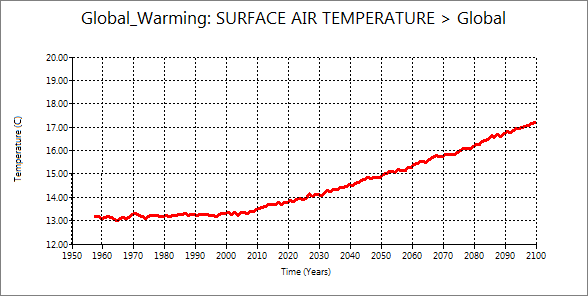
2.1. Surface temperature and sea surface temperature
| Surface air temperature | Sea surface temperature
|
|---|
 |
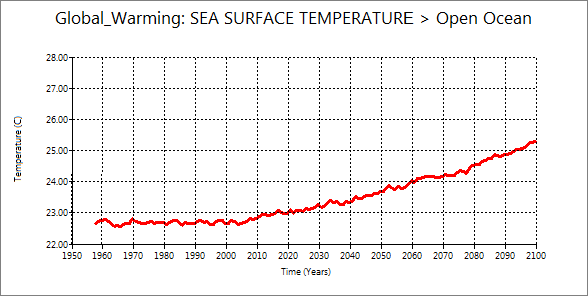 |
You will see the delay of warming of sea surface. Also, the temperature rise in surface air is
larger than sea surface. You may ask the reason why to students.
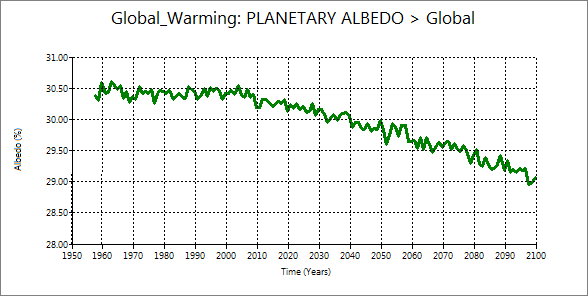
2.2 Planetary albedo and total cloud cover
| Planetary albedo | Total cloud cover |
|---|
 |
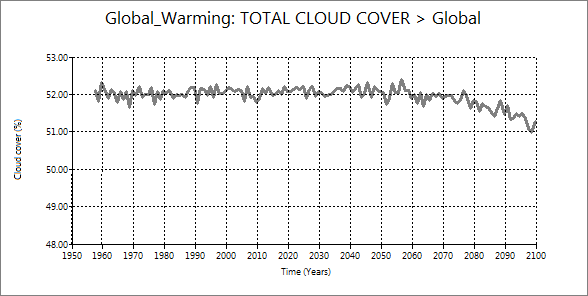 |
You can confirm that albedo decrease was not caused by the decrease of the total cloud
cover. You can see that the decrease of total cloud cover starts far later than planetary albedo starting.
2.3 Planetary albedo and ground albedo
| Planetary albedo | Ground albedo |
|---|
|
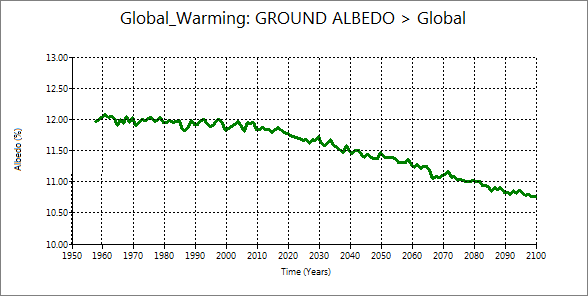 |
You can confirm that planetary albedo decrease delayed to the ground albedo decrease.
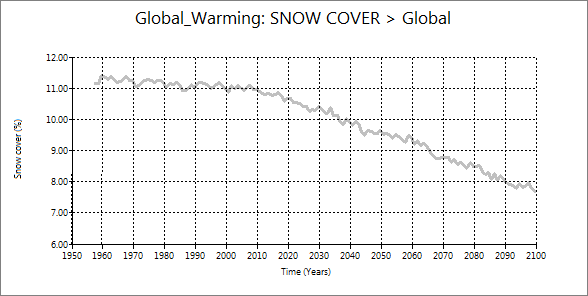
2.4 Snow cover and ocean ice cover
| Snow cover | Ocean ice cover |
|---|
 |
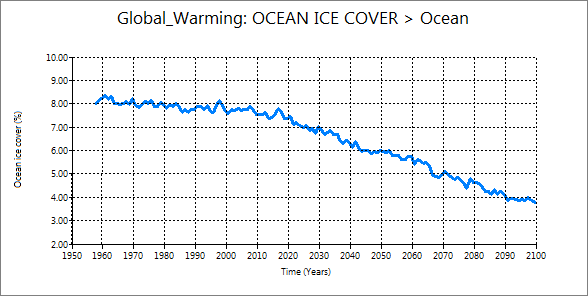 |
These two are very similar decrease. They decrease from very early time of the simulation.
Also, you can confirm that decrease of snow cover and ocean ice cover speed up at the
middle of the simulation. Also, the curves of snow cover and ocean ice cover are very similar
to those of planetary and ground albedos.
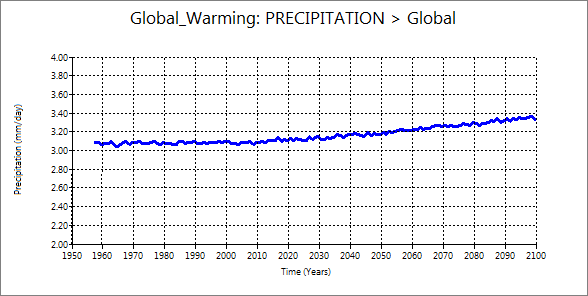
2.5 Precipitation and water content
| Precipitation | Water content |
|---|
 |
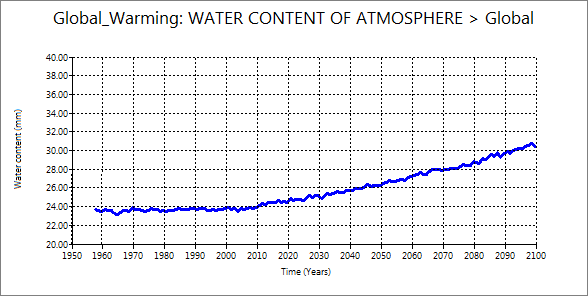 |
These two elements start to increase after 2000. However, the increase rate of water content is larger than water content. The curve of water content is similar to surface air temperature. Additional information may be required to discuss further such as saturation vapor pressure table and graph.
2.6 Precipitation and evaporation
| Precipitation | Evaporation |
|---|
|
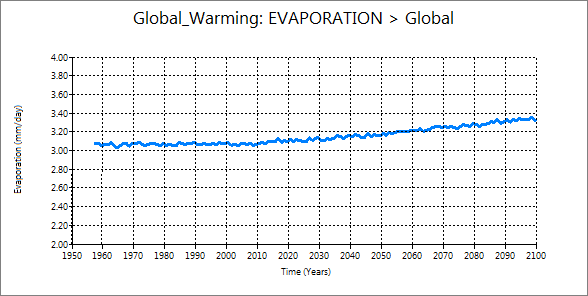 |
They show very similar change and amount. That means evaporation is basically balanced with precipitation. Therefore, the increase of water content means that increase in evaporation is larger than precipitation.
Back to Top Page