EdGCM Teaching Tips
1. How do you read the time-series output from a specific scenario
Double Carbon Dioxide (2xCO2) experiment as an example
1.1 Surface Air Temperature
- Surface air temperature is defined as the air temperature at the 1.5-2.0 meter above the ground surface.
- You can see the surface temperature rise from the beginning. Why?
- Then surface temperature fluctuate around at the 18 degree Celsius. This condition is described as "equilibrium condition is attained." Why?
- The EdGCM need more than 50 years to attain the equilibrium condition against abruptly change of carbon dioxide concentration. The time required to attain the equilibrium condition depends on the model structure and given forcing.
- The rates of temperature rise was changed in time, i.e. Large in the begging and small in later on. Why?
- It is very important that this equilibrium temperature does not depend on the initial condition. It depend and the boundary condition and climate forcing factors such as concentration of the carbon dioxide. On the other hand, weather forecasting depends on the initial condition.
- As a conclusion, surface air temperature will rise to 18 C (+4C) due to the enhanced greenhouse effects of doubled carbon dioxide concentration.
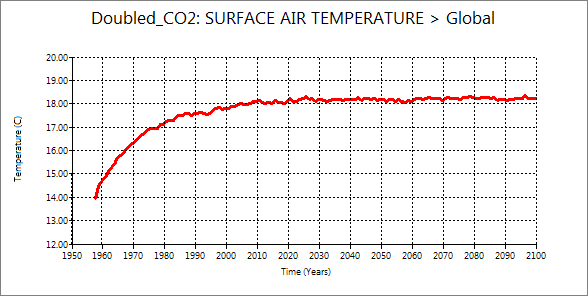
Figure 1.1. Surface Air Temperature
1.2 Sea Surface Temperature
- Sea surface temperature (SST) is defined as the water temperature close to the ocean's surface. The depth of the SST varies largely according to the measurement method from 1 millimeter (0.04 in) up to 20 meters (70 ft) below the sea surface.
- Sea surface temperature shows very similar change to the surface air temperature. However, sea surface temperature took a bit longer time to attain the equilibrium condition. Why?
- The amount of temperature rise 3 degree Celsius is smaller than the air surface temperature. Why?
- The fluctuation of sea surface temperature after attaining equilibrium looks larger than surface air temperature. This difference might be due to the scale of temperature axis. We need to care about scale of axis when you compare two results.
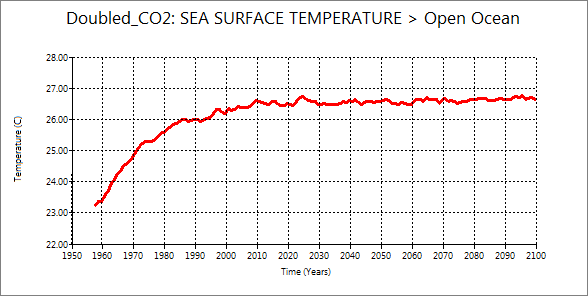
Figure 1.2. Sea Surface Temperature
1.3 Planetary Albedo
- Planetary Albedo is defined as the fraction of incident solar radiation that is reflected by a planet.
- Planetary Albedo decrease from 30.0% to 28.5%. Why?
- The rates of decrease are large in the beginning and small in later on. Why?
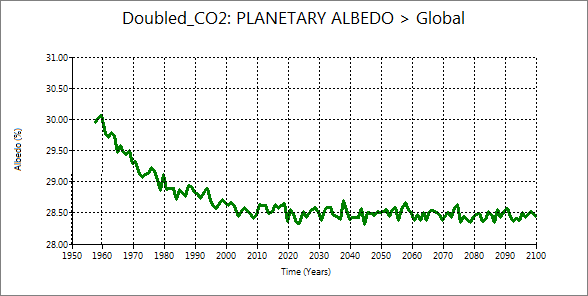
Figure 1.3. Planetary Albedo
1.4 Total Cloud Cover
- Cloud cover is defined as the fraction of the sky that is covered by the cloud. In meteorology, cloud cover is measured by three layers, i.e., upper, middle and lower layers. The total cloud cover means sum of cloud covers for each layer.
- Total cloud cover decrease linearly from 52.3% to 49.5%. Why total cloud cover decrease in relation to surface air temperature rise?
- The decrease of total cloud cover contribute the decrease of planetary Albedo but the patterns are clearly different. Why?
.
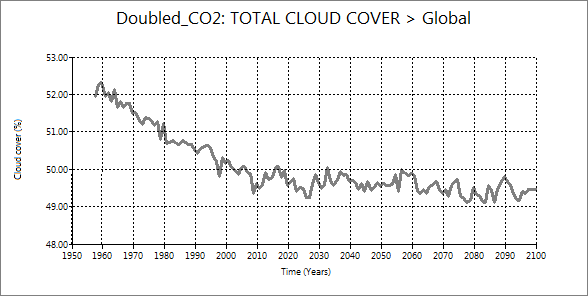
Figure 1.4. Total Cloud Cover
1.5 Ground Albedo
- Ground Albedo is defined as the fraction of incident solar radiation that is reflected by a ground surface.
- Ground Albedo decrease from 11.8% to 10.5%. Why?
- The rates of decrease are very large in the beginning and small in later on. Why?
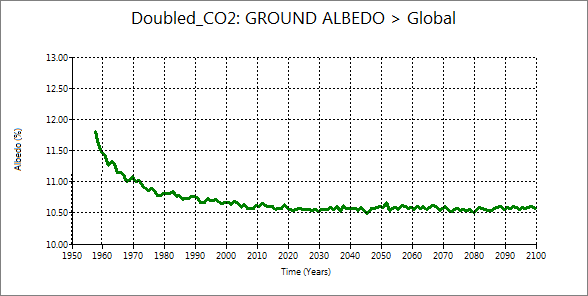
Figure 1.5. Ground Albedo
1.6 Snow Cover
- Snow cover is defined as the fraction of the globe that is covered by snow.
- Snow cover decrease from 10.9% to 7.5%. Why?
- The rates of decrease are very large in the beginning and small in later on. Why?
- The decrease pattern of snow cover is very similar to the pattern of the ground albedo. How do you think about it?
- The ice-temperature feedback
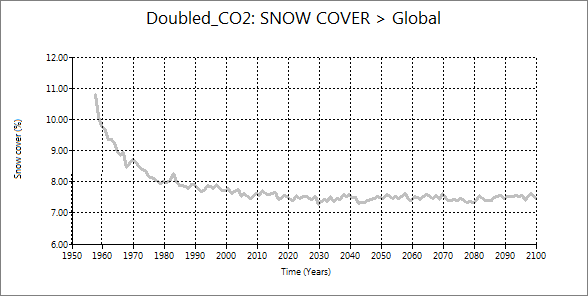
Figure 1.6. Snow Cover
1.7 Ocean Ice Cover
- Ocean ice cover is defined as the fraction of the ocean that is covered by ice.
- Ocean ice cover decrease from 10.9% to 7.5%. Why?
- The rates of decrease are very large in the beginning and small in later on. Why?
- The decrease pattern of ocean ice cover is very similar to the pattern of ground Albedo.
- The ice-temperature feedback

Figure 1.7. Ocean Ice Cover
1.8 Water Content
- Water content is defined as depth of water column measured in mm at the standard temperature and pressure contained the air column of unit cross section extending all of the way from the earth's surface to the gtoph of the atmosphere.
- Water content increase from to . Why?
- What factors are affected by the increase of water content? List up!
- Water vapor is very strong another greenhouse gas. What is the consequence of water content increase?.
- The Temperature-water vapor feedback
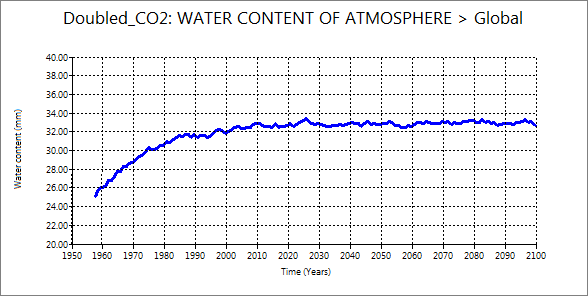
Figure 1.8. Water Content
1.9 Evaporation
- Evaporation increase from 3.1 mm/day to 3.5 mm/day.
- What is the expected results of evaporation increase from land surface?
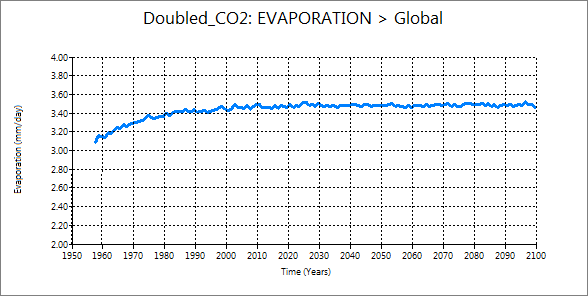
Figure 1.9. Evaporation
1.10 Precipitation
- Precipitation increase from 3.1 mm.day to 3.5 mm/day.
- What is the expected results of evaporation increase from land surface?
- Compare evaporation and precipitation.
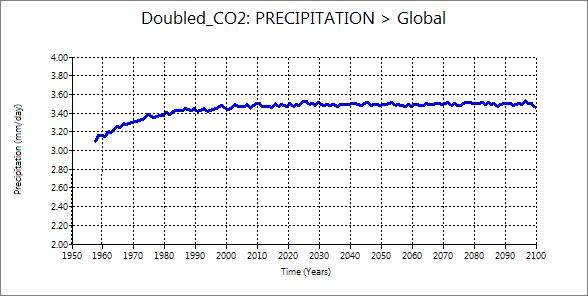
Figure 10. Precipitation
Back to Top Page


